Real Time Free Email & SMS Signal Conditions !

Live Updates

Showing posts with label gbp usd forecast. Show all posts

Monday, 5 October 2015

U.S. exports are on track to decline this year for the first time since the financial crisis.


  • U.S. exports are on track to decline this year for the first time since the financial crisis.
  • Saudi’s Aramco offers further discounts to Asia & the US
  • USD: US Non-manufacturing PMI expected to slip – TDS
  • EURUSD upside potential capped – Rabobank
  • UK's Osborne says there a lot of risks in world economy


Oil Falls 1% as Demand Doubts Rise -
Oil prices fell around 1 percent on Friday, heading for a weekly decline, as weaker-than-expected U.S. economic data weighed on the energy demand outlook and Hurricane Joaquin veered away from oil installations in the U.S. East Coast.

Gold Rises After NFP Stumble and Palladium Surge : 
Gold held the biggest advance in almost nine months after figures showed that U.S. payrolls rose less than expected and wages stagnated, reducing the possibility of an interest rate increase this year.


Trade Setups in USD-pairs around September US NFPs -
Talking Points: ST EURUSD triangle begins to break lower; $1.1085 critical support. USDJPY remains rangebound, although NFPs could change that. See the DailyFX economic calendar for Thursday, October 1, 2015.

Monday, 24 August 2015

GBPUSD Is Bullish | Free Forex Signals | Currency Trading


Get daily free forex signals on your mobile, by our research experts, based on fundamental and technical analysis.

Today we are sharing GBPUSD Currency Trading Signals.  

Daily Forex Signals
Daily Forex Signals Free


RECOMMENDATION :  BUY                                                     

TARGET 1.5800

SIGN UP FOR DAILY-FREE FOREX SIGNALS

SUMMARY:

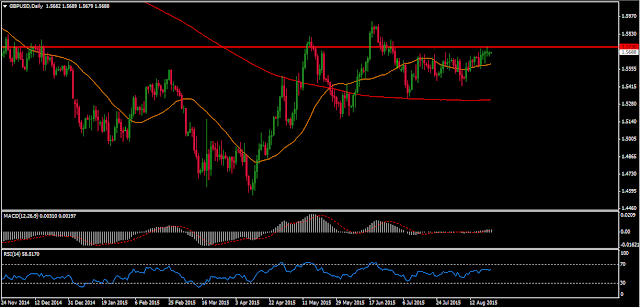
The secondary trend of GBPUSD is sideways on charts. In its daily chart, the pair is consolidating with strong positive bias to give break out at upside. Its 30 and 200 DMA are also supporting the further uptrend in the prices. If it breaks the level of 1.5730 & sustains above it then we can expect it to come up to the levels of 1.5770/1.5800  in next few days.

GBPUSD Chart Today
GBPUSD Chart Today


INDICATORS:-

RSI - Prices are sustaining in buying teritorry, supporting the upside movement in the market.
MACD is also sustaining above the zero line indicating the upside movement in the market.

STRATEGY: 

GBPUSD is looking bullish on charts for next few session. One can go for buy on dips strategy for this pair for intra day to mid term positions.


SIGN UP FOR DAILY-FREE FOREX SIGNALS


Monday, 3 August 2015

GBP/USD Is Bullish On Charts | Daily Forex Signals | Weekly Reports

Get daily free forex signals on your mobile, by our research experts, based on fundamental and technical analysis.

Today we are sharing GBP/USD Currency Trading Signals. 

Daily Forex Signals
Daily Forex Signals


SUMMARY:

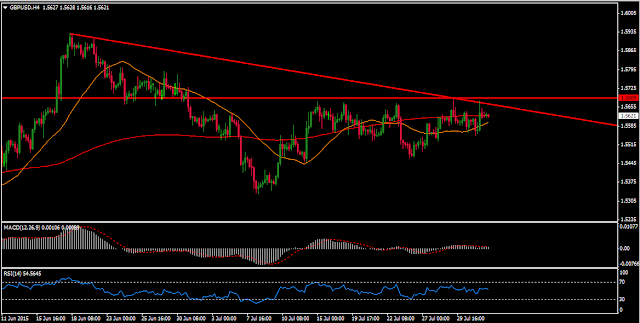
The secondary trend of GBPUSD is sideways on charts. In its 4 hourly chart, the pair is consolidating with strong positive bias to give break out at upside. Its 30 and 200 DMA are also supporting the further uptrend in the prices. If it breaks the level of 1.5690 & sustains above it then we can expect it to come up to the levels of 1.5740/1.5780  in next few days.

SIGN UP FOR DAILY-FREE FOREX SIGNALS


GBPUSD ( 4 HOURLY )

GBPUSD Weekly Chart
GBPUSD Weekly Chart


INDICATORS:-

RSI - Prices are sustaining in buying teritorry, supporting the upside movement in the market.
MACD line is also sustaining above the zero line indicating the upside movement in the market.

STRATEGY:- 

GBPUSD is looking bullish on charts for next few session. One can go for buy on dips strategy for this pair for intra day to mid term positions.


SIGN UP FOR DAILY-FREE FOREX SIGNALS


Thursday, 19 February 2015

FOREX WEEKLY FORECAST

TRY US  BEFORE YOU BUY


$EURUSD:

The EUR/USD tried to break out above the 1.15 level this week, but ran into far too much resistance and turned back around to form a shooting star. The shooting star is a negative sign and we believe that a break below the bottom of it will give selling opportunities. At that point we would anticipate a move down to the 1.10 level but we can probably go even lower given enough time. Rallies continue to offer selling opportunities.

Forecast:

The EUR/USD broke higher during the course of the session on yesterday, clearing the top of a couple of neutral candles. By doing so, it appears that the market is more than likely try to get to the 1.55 level, at that level we see a bit of resistance. With that, we would be sellers on a resistant candle, as the market is certainly in a downtrend. As of now we are sitting on sidelines.

$EURUSD CHARTS


The AUD/USD broke back and forth during the course of the week, settling on a fairly neutral candle. Because of this, it would not surprise us at all if the market rallied from here and tested the 0.80 level for resistance. We are negative of this market although we think that it might be a little bit too tight for the longer-term traders to be involved. As far as buying is concerned, we have no interest.


Forecast:

The AUD/USD broke higher during the course of the session on yesterday, but found quite a bit of resistance at the 0.78 level. With that, we fell a bit, and it appears that the sellers are still in control. The rallies can be selling opportunities, as the market should continue to be bearish. We feel that the Australian dollar will fall we down to the 0.75 level, but it may take a while to get down there. The 0.80 level above continues to be the ceiling in this market.

$AUDUSD CHARTS


The GBP/USD broke higher during the course of the week, after testing the 1.50 level. With that, the market looks as if it is ready to go higher. We believe that there is enough resistance above at the 1.55 level. With that, this just isn’t a market that we like trading from a longer-term perspective at the moment. 


Forecast:

The GBP/USD had a very strong session on yesterday as it broke above the top of the shooting star from Wednesday and now we feel that the market is ready to head back to the next major resistance at 1.55 level. With that, the market should find massive sellers in that region. With that, we believe that the shorter-term traders will be bullish while the longer-term traders will be bearish. It is expected that market will be volatile.


$GBPUSD CHARTS


The USD/JPY initially fell during the course of the week, but found enough support to turn things back around and break well above the 190 level. With that, the market almost looks as if it’s ready to reach the 120 level next, and then will give break out for longer-term buy-and-hold type of trading. We have no interest in selling this market and we believe that the 115 level is the absolute bottom of the market going forward. With that, we are very bullish after a very positive nonfarm payroll number.


Forecast:

The USD/JPY broke down during the course of the session on yesterday, falling down till the 118.50 level. However, we found a little bit of support in this area which is a strong sign. With that, we have no interest in selling. Because of that, we are looking for some type of supportive candle in order to start going long, even if it is on the shorter-term charts. We believe that this market will then head to the 121 level and after that the 122 level.


$USDJPY CHARTS


Thursday, 12 February 2015

$GBPUSD Looking Weak On Charts !

$GBPUSD Signals

SUMMARY :- 

The secondry trend of GBP/USD is bearish, the pair is sustaining on the rising trendline & consolidating with a negative bias. 30 DMA is also providing resistance to the prices. If the pair sustains below 1.5200 levels, it can come down to the levels of 1.5165/1.5140. MACD is successfully sustaining below the zero line indicating the bearish sentiment in the market.


$GBPUSD Charts


STRATEGY:- 

For Today GBP/USD is looking weak on chart. We can expect downside movement for few upcoming session. One can go for sell on higher level strategy for this pair for intra day to mid term positions.


S3
S2
S1
PIVOT
R1
R2
R3
EUR/USD 1.1220 1.1249 1.1291 1.1320 1.1362 1.1391 1.1433
GBP/USD 1.5118 1.5167 1.5203 1.5252 1.5288 1.5337 1.5373
USD/JPY 118.42 118.84 119.66 120.08 120.90 121.32 122.14
USD/CHF 0.9162 0.9193 0.9239 0.9270 0.9316 0.9347 0.9393
AUD/USD 0.7571 0.7631 0.7675 0.7735 0.7779 0.7839 0.7883
EUR/GBP 0.7331 0.7357 0.7398 0.7424 0.7465 0.7491 0.7532
USD/CAD 1.2436 1.2502 1.2568 1.2634 1.2700 1.2766 1.2832
NZD/USD 0.7219 0.7282 0.7323 0.7386 0.7427 0.7490
0.7531