Real Time Free Email & SMS Signal Conditions !

Live Updates

Showing posts with label Stock market. Show all posts

Thursday 12 February 2015

$GBPUSD Looking Weak On Charts !

$GBPUSD Signals

SUMMARY :- 

The secondry trend of GBP/USD is bearish, the pair is sustaining on the rising trendline & consolidating with a negative bias. 30 DMA is also providing resistance to the prices. If the pair sustains below 1.5200 levels, it can come down to the levels of 1.5165/1.5140. MACD is successfully sustaining below the zero line indicating the bearish sentiment in the market.


$GBPUSD Charts


STRATEGY:- 

For Today GBP/USD is looking weak on chart. We can expect downside movement for few upcoming session. One can go for sell on higher level strategy for this pair for intra day to mid term positions.


S3
S2
S1
PIVOT
R1
R2
R3
EUR/USD 1.1220 1.1249 1.1291 1.1320 1.1362 1.1391 1.1433
GBP/USD 1.5118 1.5167 1.5203 1.5252 1.5288 1.5337 1.5373
USD/JPY 118.42 118.84 119.66 120.08 120.90 121.32 122.14
USD/CHF 0.9162 0.9193 0.9239 0.9270 0.9316 0.9347 0.9393
AUD/USD 0.7571 0.7631 0.7675 0.7735 0.7779 0.7839 0.7883
EUR/GBP 0.7331 0.7357 0.7398 0.7424 0.7465 0.7491 0.7532
USD/CAD 1.2436 1.2502 1.2568 1.2634 1.2700 1.2766 1.2832
NZD/USD 0.7219 0.7282 0.7323 0.7386 0.7427 0.7490
0.7531


Monday 9 February 2015

EUR/JPY Looking Bullish On Charts!


SUMMARY:

The major trend of EUR/JPY is bearish but from past 2-3 weeks prices are not sustaining at lower levels & consolidating near the important level of 135.50. Prices has given the breakout of falling trendline & sustaining above the breakout level successful y. Prices are taking support of 30 SMA & can come up to test 200 SMA. Today if the pair breaks the psychological level of 135.35 at upside then we can expect it to test the level of 136.15.
RSI is sustaining in buying territory supporting the upcoming bullish trend in the pair. MACD line has recently break the zero line,indicating the up trend in the market.


EUR/JPY ( 4 HOURLY )


PIVOT POINTS:


S3
S2
S1
PIVOT
R1
R2
R3
EUR/USD 1.1270 1.1283 1.1299 1.1312 1.1328 1.1341 1.1357
GBP/USD 1.5193 1.5207 1.5223 1.5237 1.5253 1.5267 1.5283
USD/JPY 118.67 118.78 118.88 118.99 119.08 119.19 119.29
USD/CHF 0.9230 0.9239 0.9252 0.9261 0.9274 0.9283 0.9296
AUD/USD 0.7716 0.7738 0.7750 0.7772 0.7784 0.7806 0.7818
EUR/GBP 0.7408 0.7413 0.7418 0.7423 0.7428 0.7433 0.7438
USD/CAD 1.2479 1.2496 1.2507 1.2524 1.2535 1.2552 1.2563
NZD/USD 0.7323 0.7333 0.7342 0.7352 0.7361 0.7371 0.7380


STRATEGY : 
EUR/JPY is looking bullish on charts. One can go for buy on dips strategy for this pair for intra day to mid term positions.


Tuesday 3 February 2015

EUR/USD Is In Bearish Trend !


S3
S2
S1
PIVOT
R1
R2
R3
EUR/USD 1.1231 1.1262 1.1300 1.1331 1.1369 1.1400 1.1438
GBP/USD 1.4912 1.4959 1.4993 1.5040 1.5074 1.5121 1.5155
USD/JPY 116.44 116.78 117.19 117.53 117.94 118.28 118.69
USD/CHF 0.9060 0.9132 0.9202 0.9274 0.9344 0.9416 0.9486
AUD/USD 0.7702 0.7734 0.7766 0.7798 0.7830 0.7862 0.7894
EUR/GBP 0.7431 0.7461 0.7504 0.7534 0.7577 0.7607 0.7650
USD/CAD 1.2271 1.2412 1.2490 1.2631 1.2709 1.2850 1.2928
NZD/USD 0.7152 0.7193 0.7249 0.7290 0.7346 0.7387 0.7443


SUMMARY :- 

The first trend of EUR/USD is bearish,in its hourly chart the pair is sustaining on rising trendline & consolidating with a negative bias. For today also, we will expect it to continue its in progress trend. If EUR/USD sustains below 1.1295 levels, it will come back right down to the degree of 1.1260/1.1220. MACD is with success sustaining below the zero line indicating the bearish sentiment within the market.
RSI is also supporting the same.


SIGN UP FOR DAILY-FREE SIGNALS


EUR/USD ( HOURLY )


STRATEGY:- 

For today EUR/USD is looking weak on chart. we will expect downside movement for few future session. One will select sell on higher level strategy for this pair for intra day to middle term positions.


Monday 24 November 2014

he secondry trend of NZD/USD is bearish

Latest Forex market updates :

S3
S2
S1
PIVOT
R1
R2
R3
EUR/USD


1.2369


1.2366


1.2369


1.2366


1.2369


1.2366


1.2369
GBP/USD
1.5643
1.5640
1.5643
1.5640
1.5643
1.5640
1.5643
USD/JPY
117.51
117.62
117.72
117.83
117.92
118.03
118.12
USD/CHF
0.9668
0.9682
0.9700
0.9714
0.9732
0.9746
0.9764
AUD/USD
0.8658
0.8663
0.8672
0.8677
0.8686
0.8691
0.8700
EUR/GBP
0.7895
0.7899
0.7904
0.7908
0.7913
0.7917
0.7922
USD/CAD
1.1216
1.1223
1.1228
1.1235
1.1240
1.1247
1.1252
NZD/USD
0.7871
0.7875
0.7882
0.7886
0.7893
0.7897
0.7904


SUMMARY:
The secondry trend of NZD/USD is bearish, but prices are not sustaining on lower levels the pair is sustaining below the falling trendline & consolidating with a positive bias. If NZD/USD breaches the level of 0.7980 & sustains above it then we can expect it to come up to the levels of 0.8090. I n it daily chart 30 DMA is working as a support & prices can come up to test 200 DMA. RSI is sustaining in buying territory & indicating the upcoming buying in the pair.
In MACD , MACD line has recently breach the zero line, supporting the upside movement for next few sessions.

STRATEGY :- For this week, NZD/USD is looking strong on charts. Indicators also supporting the same. One can go for buy on dips strategy for this pair for intra day to mid term positions.
  • Activate Your Free Trial Now for #FOREX,#COMEX, #USA Stock Picks,#UK Stock Picks ,#HK Stock Picks.!!..Simply #Comment Your #Mobile Number and #E-Mail id Or Fill the Free trial Form Follow Link Here :-

Monday 17 November 2014

UK stocks ended the final session of the week with modest gains


UK MARKET OVERVIEW
UK stocks ended the final session of the week with modest gains, but struggled against weakness among the mining and energy sectors.TheFTSE has broke higher during the course of the week, clearing the 6600 level with ease and manage to end the week at 6,648.13, a gain of 12.68 points on the day and 80.89 on the week. Index is looking further strong for upcommings session and sustaining above 6600 level it can test 6900 level  continues to be one of the better performing ones in the European region with support of 6400 level.
TOP GAINER
Name
Close Price
Change %
Hays
127.3
2.17
Tesco Plc
195.1
2.07
Sainsbury
268.1
1.13
Kingfisher
296
1.75
Bg Group
1046
1.7
TOP LOSER
Name
Close Price
Change %
Sabmiller
3495
-1.69
Astrazeneca
4651
-1.71
Rexam Imperial Tobacco
442.5
-1.91
Rio Tinto
2848
-0.97
Smith & Nephew
3017
-0.9

  • Activate Your Free Trial Now for #FOREX,#COMEX, #USA Stock Picks,#UK Stock Picks ,#HK Stock Picks.!!..Simply #Comment Your #Mobile Number and #E-Mail id Or Fill the Free trial Form Follow Link Here :-


Wednesday 12 November 2014

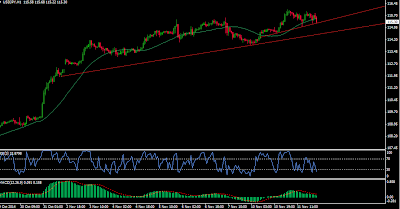
The major trend of USD/JPY is bullish


Today's Chart: USD/JPY (HOURLY )


Pivot Points


SUMMARY:
The major trend of USD/JPY is bullish, but from past few trading sessions, the pair is sustaining on the falling trendline with a negative bias, it can show some profit booking on higher levels. If the pair breaks the level 115 we can expect it to test the  level of 114.50/114 downside. RSI is sustaining in selling territory supporting the bearish sentiment in the market.  MACD line is also about to break  the zero line, supporting the same.


S3
S2
S1
PIVOT
R1
R2
R3
EUR/USD 1.2305 1.2349 1.2412 1.2456 1.2519 1.2563 1.2626
GBP/USD 1.5740 1.5786 1.5853 1.5899 1.5966 1.6012 1.6079
USD/JPY 113.69 114.15 114.97 115.43 116.25 116.71 117.53
USD/CHF 0.9530 0.9576 0.9610 0.9656 0.9690 0.9736 0.9770
AUD/USD 0.8478 0.8533 0.8610 0.8665 0.8742 0.8797 0.8874
EUR/GBP 0.7788 0.7803 0.7819 0.7834 0.7850 0.7865 0.7881
USD/CAD 1.1205 1.1259 1.1295 1.1349 1.1385 1.1439 1.1475
NZD/USD 0.7598 0.7654 0.7731 0.7787 0.7864 0.7920
0.7997

STRATEGY :- For Today, USD/JPY  is looking weak on chart. We can expect downside movement for few upcoming session. One can go for sell on higher level  strategy for this pair for intra day to mid term positions.

  • Activate Your Free Trial Now for #FOREX,#COMEX, #USA Stock Picks,#UK Stock Picks ,#HK Stock Picks.!!..Simply #Comment Your #Mobile Number and #E-Mail id Or Fill the Free trial Form Follow Link Here :-