
Showing posts with label Forex daily reports. Show all posts
Showing posts with label Forex daily reports. Show all posts
Sunday, 6 December 2015


Wednesday, 28 October 2015
GBPUSD is looking bearish on charts
Pivot
Points
|
|
S3
|
S2
|
S1
|
PIVOT
|
R1
|
R2
|
R3
|
|
EUR/USD
|
|||||||
|
GBP/USD
|
|||||||
|
USD/JPY
|
|||||||
|
USD/CHF
|
|||||||
|
AUD/USD
|
|||||||
|
USD/CAD
|
|||||||
|
0.6871
|
SUMMARY:
The secondary trend of GBPUSD is sideways on charts. In
its 4 hourly chart, the pair is sustaining above its rising trend
line and is likely to give break out at downside. It is not
sustaining at higher levels and consolidating with strong negative
bias to show downside movement in the market. Its 30 and 200 DMA are
also supporting the upcoming bearish trend in the pair. It is having
an important support at the level of 1.5280. If it breaks its support
level and sustains below it then we can expect it to show further
bearish movement in the pair.
INDICATORS:-
MACD is sustaining in selling territory supporting the
upcoming bearish trend in the pair.
RSI is also sustaining near the selling territory
indicating the upcoming bearish trend in the pair.
STRATEGY:
GBPUSD
is
looking bearish on charts for next few trading session. One can go
for sell on higher level strategy for this pair for intra day to mid
term positions.
Monday, 12 October 2015
Crude oil prices rose by around 9 percent last week.
Today's
Chart: CRUDEOIL

Overview :
Crude oil prices rose by around 9 percent last week. After hitting the psychological level of $50 and remain stable above the EMA50. Support is seen near a vertical down ward trend line and resistance level at $49.03, while resistance is seen near a EMA200 level at $51.94. Expected trading range for today $49.03 support level and $51.94 resistance level. On an intra day basis, we expect the positive momentum to continue the short term bearish trend. On the upside resistance level at $50.11, if market break this resistance level upside breakout is expected with potential target of $51.54
|
|
R2
|
R1
|
S1
|
S2
|
|
Gold |
1186
|
1171
|
1159
|
1149
|
|
SILVER |
16.24
|
16.11
|
15.73
|
15.52
|
|
CRUDE OIL |
53.17
|
51.14
|
47.45
|
45.67
|
|
COPPER |
2.4693
|
2.4419
|
2.3863
|
2.3507
|
|
NATURAL GAS |
2.614
|
2.564
|
2.492
|
2.453
|
|
PLATINUM |
1003
|
996
|
976
|
965
|
|
PALLADIUM |
742
|
721
|
700
|
683
|
Monday, 28 September 2015
Five Points which can drive markets early this week
The market hasn't made any big moves so far but a few are beginning to brew
1. Yen strength
2. GBP strength
3. Oil weakness
4. Bonds bid
5. China worries, China stimulus

The market hasn't made any big moves so far but a few are beginning to brew:
1. Yen strength
This is all about negative sentiment in stocks. USD/JPY is down 27 pips. The Nikkei finished the morning session down 1.14%, Shanghai stocks are down 0.54% and S&P 500 futures are down 0.4%. Earlier I wrote about why stock markets could fall early this week.
2. GBP strength
The pound is keeping pace with the yen, up about 20 pips. But let's put that into perspective; since the high on September 18, cable has been in a 6 day, nearly 500 pips swoon. A 20 pip bounce doesn't even qualify as a dead cat bounce. I highlighted some levels earlier.
3. Oil weakness
All else being equal, sell oil. Crude is down about 1%. Rig count numbers on Friday were bullish but a small bounce was wiped out quickly. Earlier last week, inventory numbers were bullish but a bounce was wiped out within hours and oil finished way down. At some point this year, oil storage capacity will max out and it will be dumped onto the market at any price.
4. Bonds bid
Bonds are catching a small bid, pushing 10-year US yields down 2 bps in early trading. There was talk of a China bid but it's also part of the risk aversion theme.
5. China worries, China stimulus
Two stories out of China early this week. The first is a plunge in industrial profits (negative) but the second is about fresh stimulus (potentially very positive). The second story hasn't gotten much traction yet but I think it could.
SIGN UP FOR DAILY-FREE FOREX SIGNALS
Sunday, 20 September 2015
RIP Shaikh Rashid bin Mohammed bin Rashid Al Maktoum
Mourning declared following the death of HH Sheikh Rashid bin Mohammed bin Rashid Al Maktoum

Three days of mourning have been declared following the death of HH Sheikh Rashid bin Mohammed bin Rashid Al Maktoum.
Sheikh Rashid was the eldest son of HH Sheikh Mohammed bin Rashid Al Maktoum, Vice President and Prime Minister of the UAE and Ruler of Dubai.

Al Dewan, Dubai Ruler’s Court, has declared three days mourning in Dubai, beginning today.
Shaikh Rashid was the eldest son of His Highness Shaikh Mohammad Bin Rashid Al Maktoum, Vice President and Prime Minister of the UAE and Ruler of Dubai. Shaikh Rashid was a keen horse lover and was the owner of Zabeel Stables.
President His Highness Shaikh Khalifa Bin Zayed Al Nahyan mourned the death of Shaikh Rashid. Shaikh Khalifa expressed his heartfelt condolences and solace to Shaikh Mohammad.


Flags will fly half-mast at all government institutions in the emirate.
Sheikh Rashid was a well-known sports figure in the UAE. He participated in a number of International and local Endurance competitions winning a number of laurels for the country. His greatest achievement was winning 2 Gold medals in the 2006 Doha Asian Olympics 120 km Endurance individual mixed as well as 120 km Endurance Team Mixed events.
For Free Forex , Comex , CFD Signals you can fill this form :
Tuesday, 8 September 2015
Gold inches higher, but struggles to shine

Technical
- Levels
R2
|
R1
|
S1
|
S2
|
|
| Gold |
1148
|
1130
|
1109
|
1097
|
| SILVER |
14.96
|
14.75
|
14.44
|
14.23
|
| CRUDE OIL |
47.12
|
45.93
|
43.82
|
42.11
|
| COPPER |
2.436
|
2.410
|
2.372
|
2.308
|
| NATURAL GAS |
2.712
|
2.693
|
2.635
|
2.612
|
| PLATINUM |
1035
|
1002
|
977
|
967
|
| PALLADIUM |
1014
|
591
|
568
|
558
|
Gold futures traded modestly higher Tuesday as investors looked ahead to the Federal Reserves’s policy meeting next week, which could determine the direction of the dollar and dollar-denominated commodities like gold.
Gold for December delivery was marginally higher, gaining $1, or about 0.1%, at $1,122.10 an ounce, after swinging between small gains and losses in early Tuesday action.
The precious metal has been down nine of that past 11 sessions and hasn’t drawn much of a bid in recent weeks on the expectation that the Fed may raise interest rates for the first time since 2006. Interest-bearing assets like Treasurys have diminished the appeal of gold, which doesn’t bear any interest, while anticipation of a near-term rate increase has dulled expectations for gold.
SIGN UP FOR DAILY-FREE FOREX SIGNALS
Thursday, 3 September 2015
European stocks reversed earlier losses to close higher Wednesday
SIGN UP FOR DAILY-FREE FOREX SIGNALS

SUMMARY:

European stocks reversed earlier losses to close
higher Wednesday, with worries about an economic slowdown in China
offset by a strong open on Wall Street. France's CAC 40 was up by
13.76 points to 4,554.92 and Germany's DAX 30 gain 32.48 points to
10,048.05. FTSE 100 also managed to close at 6,083.31 with net gain
of 24.77. US stocks ended higher on Wednesday, rebounding from two
days of losses. The Dow Jones 30 gain 293.03 points to 16,351.38,
while the S&P 500 and the Nasdaq 100 also gain 35.01 and 113.90
points to 1,948.86 and 4265.23 respectively. Asian markets traded on
mix today. Japan’s Nikkei 225 which is only index traded on green
note and up by 148.23 points to 18,243.63. Other Asian index like
Hong Kong’s Hang Seng 50 Index is off today and Australia’s
S&P/ASX 200 closed at negative note.
|
Index
|
Value
|
Net Change
|
|
16,351.38
|
+293.03
|
|
|
1,948.86
|
+35.01
|
|
|
4256.23
|
+113.9
|
|
|
10,048.05
|
+32.48
|
|
|
FTSE100
|
6,083.31
|
+24.77
|
|
4,554.92
|
+13.76
|
|
|
Nikkei225
|
18,243.63
|
+148.23
|
|
5,041.50
|
-59.96
|
|
|
Hang Seng50
|
20,934.94
|
0.00
|
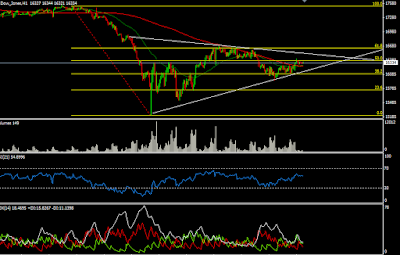
Major trend of Dow Jones
30 is bearish on daily charts. It has given upside recovery in last
week trading session. It is again showing good recovery from lower
level. It is likely to give northward movement in upcoming session
as it has give closing below 50 DMA and trading with resistance of
200 DMA on hourly chart. On lower side it has support level of
16100. If it manages to sustain above 50 DMA and gives break out
above 200 DMA then it would bring a strong confidence to reach 16700.
Currently it is having resistance of 16400.
INDICATOR:-
RSI is about to cross up the 50 mark on hourly chart
time frame. On ADX is likely to move up with strong accumulation on
chart. ADX trading above 35 mark. If it sustain above the same then
index would come in positive territory with positive DI has crossed
up negative DI .

Thursday, 2 July 2015
EURCAD Is Bullish On Charts | Free Forex Signals | Currency Trading
Get daily free forex signals on your mobile, by our research experts, based on fundamental and technical analysis.
Today we are sharing EUR/USD Currency Trading Signals.

SUMMARY :
The primary trend of EURCAD is bullish on charts. In its hourly chart, prices are successfully sustaining at higher levels and consolidating with strong positive bias to continue its up rally. Its 30 and 200 DMA are also providing support to the upward movement in the prices. If it crosses its resistance level of 1.3965 then we can expect it to come up to the levels of 1.3995/1.4035 in today's trading session.
SIGN UP FOR DAILY-FREE FOREX SIGNALS
INDICATORS:
MACD is sustaining in buying territory, supporting the upside movement in the market.
RSI is sustaining in buying territory, supporting the upside movement in the market.
STRATEGY:
EURCAD is looking bullish on charts for next few session. One can go for buy on dips strategy for this pair for intra day to mid term positions.
SIGN UP FOR DAILY-FREE FOREX SIGNALS
Today we are sharing EUR/USD Currency Trading Signals.

SUMMARY :
The primary trend of EURCAD is bullish on charts. In its hourly chart, prices are successfully sustaining at higher levels and consolidating with strong positive bias to continue its up rally. Its 30 and 200 DMA are also providing support to the upward movement in the prices. If it crosses its resistance level of 1.3965 then we can expect it to come up to the levels of 1.3995/1.4035 in today's trading session.
SIGN UP FOR DAILY-FREE FOREX SIGNALS
EURCAD
( Hourly ) :
 |
| EURCAD Chart Today |
INDICATORS:
MACD is sustaining in buying territory, supporting the upside movement in the market.
RSI is sustaining in buying territory, supporting the upside movement in the market.
STRATEGY:
EURCAD is looking bullish on charts for next few session. One can go for buy on dips strategy for this pair for intra day to mid term positions.
SIGN UP FOR DAILY-FREE FOREX SIGNALS
Thursday, 30 April 2015
AUDUSD Is Bullish | Free Forex Signals | AUDUSD Chart Today
Get daily free forex signals on your mobile, by our research experts, based on fundamental and technical analysis.
Today we are sharing AUDUSD Currency Trading Signals

SUMMARY :
The primary trend of AUDUSD is bullish on charts but from the past few trading sessions, prices are no more sustaining at higher levels & looking weak for the upcoming sessions. The pair is consolidating with strong negative bias to give breakout at downside. 30 DMA is also supporting the further downtrend in the prices. It is also taking support at an important level of 0.7970. Today if the pair breaks its support level & manages to sustain below it, then we can expect it to test the level of 0.7920/0.7890 in today's session.
AUDUSD
( 30 Min )

INDICATORS:-
MACD line is also sustaining in the selling territory, indicating the bearish trend in the pair.
STRATEGY :
AUDUSD is looking further bearish on charts. One can go for sell on higher level strategy for this pair for intra day to mid term positions.
PIVOT POINTS :
If you are interested for FREE FOREX SIGNALS sign up now.
Monday, 16 March 2015
Weekly Forex Report : $EURAUD And $AUDCAD
 |
| Free Trading Signals & Strategies |
RECOMMENDATION : SELL
TARGET 1.3600
EUR/AUD ( HOURLY)
 |
| $EURUSD CHARTS |
SUMMARY:
The primary trend of EUR/AUD is bearish. In its hourly chart, prices are consolidating with a strong negative bias, indicating the downside movement in the prices. 30 DMA & 200 DMA are also providing resistance to the prices & supporting the further downtrend. If it breaks the level of 1.3730 & sustains below it we can expect it to come down to the levels of 1.3660/1.3600 in next few days.
INDICATORS:
RSI is sustaining near in selling territory, supporting the upcoming down trend in the pair.
In MACD
Prices are sustaining below the zero line ,supporting the down side movement in the market
STRATEGY:
EUR/AUD is looking bearish on charts for next few session. One can go for sell on higher level strategy for this pair for intra day to mid term positions.
AUD/CAD (4 HOURLY )
RECOMMENDATION : BUY
TARGET 0.9945
SUMMARY:
The major trend of AUD/CAD is bearish but from past few weeks prices are not sustaining at lower levels & consolidating near the important level of 0.9810. Prices are taking resistance of falling trendline & consolidating with strong positive bias. If the pair breaks the important level of 0.9810 at upside then we can expect it to test the level of 0.9880/0.9945.
INDICATORS:
RSI is sustaining in buying territory supporting the upcoming bullish trend in the pair. MACD is also sustaining above the zero line,indicating the up trend in the market.
STRATEGY:
AUD/CAD has bounced back from the lower level & looking bullish on charts for next few session. One can go for buy on dips strategy for this pair for intra day to mid term positions.
SIGN UP FOR DAILY-FREE FOREX SIGNALS
Wednesday, 11 March 2015
$EURCHF Is Bullish - But Not Sustaining at Higher Levels !
 |
| SIGNALS & STRATEGIES |
SUMMARY :
The secondary trend of EUR/CHF is bullish but prices are no more sustaining at higher levels & looking weak for the upcoming sessions. The pair is consolidating with strong negative bias to give a breakout at downside. Prices are also taking support at the important level of 1.0650 Today if the pair breaks its support level & managed to sustain below it, then we can expect it to continue to trade with negative bias & test the level of 1.0570 in today's session. RSI is also sustaining in selling territory supporting downside movement in the pair.
SIGN UP FOR DAILY-FREE FOREX SIGNALS
EUR/CHF(
4 Hourly )
 |
| $EURCHF CHARTS |
STRATEGY :
EUR/CHF is looking further bearish on charts. One can go for sell on higher level strategy for this pair for intra day to mid term positions.
PIVOT POINTS :
|
|
S3
|
S2
|
S1
|
PIVOT
|
R1
|
R2
|
R3
|
|
EUR/USD |
|||||||
|
GBP/USD |
|||||||
|
USD/JPY |
|||||||
|
USD/CHF |
|||||||
|
AUD/USD |
|||||||
|
EUR/GBP |
|||||||
|
USD/CAD |
|||||||
|
NZD/USD |
0.7454
|
SIGN UP FOR DAILY-FREE FOREX SIGNALS
Subscribe to:
Posts (Atom)