Real Time Free Email & SMS Signal Conditions !

Live Updates

Showing posts with label UK. Show all posts

Tuesday 5 May 2015

USDJPY Is Bullish | Free Forex Signals | Currency Trading

Get daily free forex signals on your mobile, by our research experts, based on fundamental and technical analysis.

Today we are sharing USDJPY Currency Trading Signals

Daily Forex Signals
Daily Forex Signals


SUMMARY : 

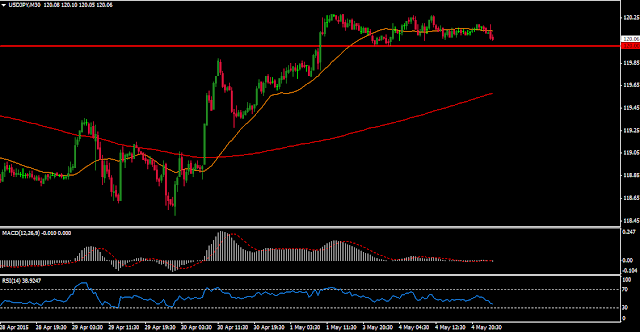
The primary trend of USD/JPY is bullish but from the past few trading sessions, prices are no more sustaining at higher levels & looking weak for the upcoming sessions. The pair is consolidating with strong negative bias to give a breakout at downside. Prices are also taking support at the important level of 120. Today if the pair breaks its support level & managed to sustain below it, then we can expect it to test the level of  119.60/119.30 in today's session.


USD/JPY ( 30 Minutes ) :

USDJPY Chart Today


INDICATORS :

RSI is sustaining near the selling territory, indicating the upcoming bearish trend in the pair.
MACD has recently breached the zero line, indicating the upcoming bearish trend in the pair.

STRATEGY : 

USD/JPY is looking further bearish on charts. One can go for sell on higher level strategy for this pair for intra day to mid term positions.

PIVOT POINTS :


S3
S2
S1
PIVOT
R1
R2
R3
EUR/USD
1.0997
1.1059
1.1102
1.1164
1.1207
1.1269
1.1312
GBP/USD
1.4992
1.5040
1.5080
1.5128
1.5168
1.5216
1.5256
USD/JPY
119.63
119.80
119.97
120.14
120.31
120.48
120.65
USD/CHF
0.9223
0.9265
0.9301
0.9343
0.9379
0.9421
0.9457
AUD/USD
0.7754
0.7777
0.7807
0.7830
0.7860
0.7883
0.7913
EUR/GBP
0.7297
0.7323
0.7347
0.7373
0.7397
0.7423
0.7447
USD/CAD
1.1957
1.2020
1.2057
1.2120
1.2157
1.2220
1.2257
NZD/USD
0.7452
0.7479
0.7508
0.7535
0.7564
0.7591
0.7620


Monday 16 March 2015

Weekly Forex Report : $EURAUD And $AUDCAD


Free Trading Signals & Strategies 


RECOMMENDATION : SELL
TARGET 1.3600


EUR/AUD ( HOURLY)

$EURUSD CHARTS


SUMMARY:
The primary trend of EUR/AUD is bearish. In its hourly chart, prices are consolidating with a strong negative bias, indicating the downside movement in the prices. 30 DMA & 200 DMA are also providing resistance to the prices & supporting the further downtrend.  If it breaks the level of 1.3730 & sustains below it we can expect it to come down to the levels of 1.3660/1.3600  in next few days.

INDICATORS:
RSI is sustaining near in selling territory, supporting the upcoming down trend in the pair.
In MACD
Prices are sustaining below the zero line ,supporting the down side movement in the market

STRATEGY: 
EUR/AUD is looking bearish on charts for next few session. One can go for sell on higher level strategy for this pair for intra day to mid term positions.


AUD/CAD (4 HOURLY )

RECOMMENDATION : BUY
TARGET 0.9945

FOR FREE CHARTS & SIGANLS

SUMMARY:


The major trend of AUD/CAD is bearish but from past few weeks prices are not sustaining at lower levels & consolidating near the important level of 0.9810. Prices are taking resistance  of falling trendline & consolidating with strong positive bias. If the pair breaks the important level of 0.9810 at upside then we can expect it to test the level of 0.9880/0.9945. 

INDICATORS:

RSI is sustaining in buying territory supporting the upcoming bullish trend in the pair. MACD is also sustaining above the zero line,indicating the up trend in the market.

STRATEGY:

AUD/CAD has bounced back from the lower level & looking bullish on charts for next few session. One can go for buy on dips strategy for this pair for intra day to mid term positions.


SIGN UP FOR DAILY-FREE FOREX SIGNALS


Friday 13 March 2015

US STOCKS REBOUND !

US stocks rebounded from a two day losing streak on Thursday, as the dollar retreated from a 12 year high, the Dow Jones Industrial Average was up 1.47% to 17,895.22, the S&P 500 climbed 1.3% to 2,065.95 and the Nasdaq Composite jumped 0.89% to 4,893.29. Asian markets excluding China opened positive tracking gains from Wall Street thanks .In Asia, Asian markets, Hong Kong’s Hang Seng rose by 0.15 per cent and Japan’s Nikkei was up by 1.44 per cent in early trade today .

FREE TRADING SIGNALS


SUMMARY:

The CAC 40 index is in major up trend and making higher top and higher bottom formation on hourly char. Index is upward channel and trading with positive biassed. It is likely to  show northward movement in upcoming session if it manages to sustain above lower support line.
Support has been found at around the level of lower support line at 4870 on intra day chart, which is also above the low seen on previous significant low. Index futures Closing above 5006 would certainly make for some further buying in it with a possible target around 5150 and then 5300.

SIGN UP FOR DAILY-FREE FOREX SIGNALS


Market View :

Index
Value
Net Change
FTSE 100
6762.3
0.8
DAX 30
11845.6
12.6
CAC 40
5003.7
4.2
Dow Jones30
17887.5
21.5
S&P500
2067.5
3.5
Nasdaq 100
43.36.20
5.45
ASX200
5815
-38
Hang Seng 50
23783
28
Nikkei
19192.5
185.5


CAC40 (1 HOURLY )

CHARTS


INDICATOR : 

Indicators also supporting the same upward movement in upcoming session. As RSI is converging with upward trend sustaining above of 50 mark
Index has give closing above 50 DMA and 200 DMA on daily chart and ADX is indicating that market may pick up its bullish momentum in upcoming trading session.


SIGN UP FOR DAILY-FREE FOREX SIGNALS


Thursday 12 March 2015

$AUDCAD Indicating The Positive Side Movement

FREE SIGNALS & STRATEGIES


SUMMARY :  

The overall trend of AUD/CAD is sideways, but from the last few days prices are not sustaining at lower levels & taking resistance of falling trend line & consolidating with a positive bias. In its hourly chart the pair is forming a falling channel which indicates the prices to show upside movement. 30 DMA  is also acting as a support for the prices & can come up to test 200 DMA, indicating the strength for the northward journey. If AUD/CAD crosses the level of 0.9720 it can come up to the levels of 0.9780/0.9820 in today’s trading session.

SIGN UP FOR DAILY-FREE FOREX SIGNALS


AUD/CAD ( Hourly )

CHARTS


INDICATORS:

RSI is sustaining in buying territory & indicating the positive side movement for the day.
In MACD, MACD line has crossed the zero line & supporting the upside movement for next few sessions. 

STRATEGY: 

AUD/CAD  has bounced back from the lower level & looking bullish on charts for next few session. One can go for buy on dips strategy for this pair for intra day to mid term positions.


PIVOT POINTS :


S3
S2
S1
PIVOT
R1
R2
R3
EUR/USD
1.0255
1.0382
1.0464
1.0591
1.0673
1.0800
1.0882
GBP/USD
1.4640
1.4766
1.4848
1.4974
1.5056
1.5182
1.5264
USD/JPY
120.21
120.53
120.99
121.31
121.77
122.09
122.55
USD/CHF
0.9858
0.9912
1.0002
1.0056
1.0146
1.0200
1.0290
AUD/USD
0.7466
0.7512
0.7554
0.7600
0.7642
0.7688
0.7730
EUR/GBP
0.6915
0.6963
0.7014
0.7062
0.7113
0.7161
0.7212
USD/CAD
1.2540
1.2601
1.2676
1.2737
1.2812
1.2873
1.2948
NZD/USD
0.7086
0.7134
0.7214
0.7262
0.7342
0.7390
0.7470


SIGN UP FOR DAILY-FREE FOREX SIGNALS


Wednesday 11 March 2015

$EURCHF Is Bullish - But Not Sustaining at Higher Levels !

SIGNALS & STRATEGIES

SUMMARY : 

The secondary trend of EUR/CHF is bullish but prices are no more sustaining at higher levels & looking weak for the upcoming sessions. The pair is consolidating with strong negative bias to give a breakout at downside. Prices are also taking support at the important level of 1.0650 Today if the pair breaks its support level & managed to sustain below it, then we can expect it to continue to trade with negative bias & test the level of  1.0570 in today's session. RSI is also sustaining in selling territory supporting downside movement in the pair. 

SIGN UP FOR DAILY-FREE FOREX SIGNALS


EUR/CHF( 4 Hourly )

$EURCHF CHARTS 


STRATEGY : 

EUR/CHF is looking further bearish on charts. One can go for sell on higher level strategy for this pair for intra day to mid term positions.


PIVOT POINTS :


S3
S2
S1
PIVOT
R1
R2
R3
EUR/USD
1.0475
1.0583
1.0640
1.0748
1.0805
1.0913
1.0970
GBP/USD
1.4915
1.4971
1.5021
1.5077
1.5127
1.5183
1.5233
USD/JPY
119.57
120.24
120.69
121.36
121.81
122.48
122.93
USD/CHF
0.9748
0.9799
0.9898
0.9949
1.0048
1.0099
1.0198
AUD/USD
0.7472
0.7537
0.7581
0.7646
0.7690
0.7755
0.7799
EUR/GBP
0.6971
0.7030
0.7064
0.7123
0.7157
0.7216
0.7250
USD/CAD
1.2530
1.2563
1.2626
1.2659
1.2722
1.2755
1.2818
NZD/USD
0.7115
0.7182
0.7228
0.7295
0.7341
0.7408
0.7454


SIGN UP FOR DAILY-FREE FOREX SIGNALS


Thursday 19 February 2015

FOREX WEEKLY FORECAST

TRY US  BEFORE YOU BUY


$EURUSD:

The EUR/USD tried to break out above the 1.15 level this week, but ran into far too much resistance and turned back around to form a shooting star. The shooting star is a negative sign and we believe that a break below the bottom of it will give selling opportunities. At that point we would anticipate a move down to the 1.10 level but we can probably go even lower given enough time. Rallies continue to offer selling opportunities.

Forecast:

The EUR/USD broke higher during the course of the session on yesterday, clearing the top of a couple of neutral candles. By doing so, it appears that the market is more than likely try to get to the 1.55 level, at that level we see a bit of resistance. With that, we would be sellers on a resistant candle, as the market is certainly in a downtrend. As of now we are sitting on sidelines.

$EURUSD CHARTS


The AUD/USD broke back and forth during the course of the week, settling on a fairly neutral candle. Because of this, it would not surprise us at all if the market rallied from here and tested the 0.80 level for resistance. We are negative of this market although we think that it might be a little bit too tight for the longer-term traders to be involved. As far as buying is concerned, we have no interest.


Forecast:

The AUD/USD broke higher during the course of the session on yesterday, but found quite a bit of resistance at the 0.78 level. With that, we fell a bit, and it appears that the sellers are still in control. The rallies can be selling opportunities, as the market should continue to be bearish. We feel that the Australian dollar will fall we down to the 0.75 level, but it may take a while to get down there. The 0.80 level above continues to be the ceiling in this market.

$AUDUSD CHARTS


The GBP/USD broke higher during the course of the week, after testing the 1.50 level. With that, the market looks as if it is ready to go higher. We believe that there is enough resistance above at the 1.55 level. With that, this just isn’t a market that we like trading from a longer-term perspective at the moment. 


Forecast:

The GBP/USD had a very strong session on yesterday as it broke above the top of the shooting star from Wednesday and now we feel that the market is ready to head back to the next major resistance at 1.55 level. With that, the market should find massive sellers in that region. With that, we believe that the shorter-term traders will be bullish while the longer-term traders will be bearish. It is expected that market will be volatile.


$GBPUSD CHARTS


The USD/JPY initially fell during the course of the week, but found enough support to turn things back around and break well above the 190 level. With that, the market almost looks as if it’s ready to reach the 120 level next, and then will give break out for longer-term buy-and-hold type of trading. We have no interest in selling this market and we believe that the 115 level is the absolute bottom of the market going forward. With that, we are very bullish after a very positive nonfarm payroll number.


Forecast:

The USD/JPY broke down during the course of the session on yesterday, falling down till the 118.50 level. However, we found a little bit of support in this area which is a strong sign. With that, we have no interest in selling. Because of that, we are looking for some type of supportive candle in order to start going long, even if it is on the shorter-term charts. We believe that this market will then head to the 121 level and after that the 122 level.


$USDJPY CHARTS


Tuesday 3 February 2015

EUR/USD Is In Bearish Trend !


S3
S2
S1
PIVOT
R1
R2
R3
EUR/USD 1.1231 1.1262 1.1300 1.1331 1.1369 1.1400 1.1438
GBP/USD 1.4912 1.4959 1.4993 1.5040 1.5074 1.5121 1.5155
USD/JPY 116.44 116.78 117.19 117.53 117.94 118.28 118.69
USD/CHF 0.9060 0.9132 0.9202 0.9274 0.9344 0.9416 0.9486
AUD/USD 0.7702 0.7734 0.7766 0.7798 0.7830 0.7862 0.7894
EUR/GBP 0.7431 0.7461 0.7504 0.7534 0.7577 0.7607 0.7650
USD/CAD 1.2271 1.2412 1.2490 1.2631 1.2709 1.2850 1.2928
NZD/USD 0.7152 0.7193 0.7249 0.7290 0.7346 0.7387 0.7443


SUMMARY :- 

The first trend of EUR/USD is bearish,in its hourly chart the pair is sustaining on rising trendline & consolidating with a negative bias. For today also, we will expect it to continue its in progress trend. If EUR/USD sustains below 1.1295 levels, it will come back right down to the degree of 1.1260/1.1220. MACD is with success sustaining below the zero line indicating the bearish sentiment within the market.
RSI is also supporting the same.


SIGN UP FOR DAILY-FREE SIGNALS


EUR/USD ( HOURLY )


STRATEGY:- 

For today EUR/USD is looking weak on chart. we will expect downside movement for few future session. One will select sell on higher level strategy for this pair for intra day to middle term positions.


Wednesday 19 November 2014

The major trend of EUR/JPY is bullish

Pivot Points :

S3
S2
S1
PIVOT
R1
R2
R3
EUR/USD
1.2365
1.2403
1.2470
1.2508
1.2575
1.2613
1.2680
GBP/USD
1.5559
1.5593
1.5613
1.5647
1.5667
1.5701
1.5721
USD/JPY
115.76
116.05
116.46
116.75
117.16
117.45
117.86
USD/CHF
0.9467
0.9520
0.9551
0.9604
0.9635
0.9688
0.9719
AUD/USD
0.8612
0.8646
0.8683
0.8717
0.8754
0.8788
0.8825
EUR/GBP
0.7904
0.7928
0.7974
0.7998
0.8044
0.8068
0.8114
USD/CAD
1.1191
1.1223
1.1259
1.1291
1.1327
1.1359
1.1395
NZD/USD
0.7826
0.7866
0.7894
0.7934
0.7962
0.8002
0.8030


SUMMARY:
The major trend of EUR/JPY is bullish, after showing some profit booking at higher level  the pair is now consolidating with a positive bias. In its  hourly chart the pair is taking resistance of falling trend line,given breakout & sustaining above the level,  the pair can show upside movement after crossing of the resistance level at 147 ,we can expect it to test the level of 147.50  by the end of the session 

STRATEGY :- EUR/JPY  is consolidating with positive bias & expected to show positive movement. The pair is looking bullish on charts. One can go for buy on dips strategy for this pair for intra day to mid term positions.
  • Activate Your Free Trial Now for #FOREX,#COMEX, #USA Stock Picks,#UK Stock Picks ,#HK Stock Picks.!!..Simply #Comment Your #Mobile Number and #E-Mail id Or Fill the Free trial Form Follow Link Here :-