Real Time Free Email & SMS Signal Conditions !

Live Updates

Sunday 20 September 2015

RIP Shaikh Rashid bin Mohammed bin Rashid Al Maktoum


Mourning declared following the death of HH Sheikh Rashid bin Mohammed bin Rashid Al Maktoum


Three days of mourning have been declared following the death of HH Sheikh Rashid bin Mohammed bin Rashid Al Maktoum.
Sheikh Rashid was the eldest son of HH Sheikh Mohammed bin Rashid Al Maktoum, Vice President and Prime Minister of the UAE and Ruler of Dubai.
Al Dewan, Dubai Ruler’s Court, has declared three days mourning in Dubai, beginning today.
Shaikh Rashid was the eldest son of His Highness Shaikh Mohammad Bin Rashid Al Maktoum, Vice President and Prime Minister of the UAE and Ruler of Dubai. Shaikh Rashid was a keen horse lover and was the owner of Zabeel Stables.
President His Highness Shaikh Khalifa Bin Zayed Al Nahyan mourned the death of Shaikh Rashid. Shaikh Khalifa expressed his heartfelt condolences and solace to Shaikh Mohammad.


Flags will fly half-mast at all government institutions in the emirate.
Sheikh Rashid was a well-known sports figure in the UAE. He participated in a number of International and local Endurance competitions winning a number of laurels for the country. His greatest achievement was winning 2 Gold medals in the 2006 Doha Asian Olympics 120 km Endurance individual mixed as well as 120 km Endurance Team Mixed events.
For Free Forex , Comex , CFD  Signals you can fill this form :

Tuesday 8 September 2015

Gold inches higher, but struggles to shine


Technical - Levels


R2
R1
S1
S2
Gold
1148
1130
1109
1097
SILVER
14.96
14.75
14.44
14.23
CRUDE OIL
47.12
45.93
43.82
42.11
COPPER
2.436
2.410
2.372
2.308
NATURAL GAS
2.712
2.693
2.635
2.612
PLATINUM
1035
1002
977
967
PALLADIUM
1014
591
568
558


Overview :


Gold futures traded modestly higher Tuesday as investors looked ahead to the Federal Reserves’s policy meeting next week, which could determine the direction of the dollar and dollar-denominated commodities like gold.
Gold for December delivery was marginally higher, gaining $1, or about 0.1%, at $1,122.10 an ounce, after swinging between small gains and losses in early Tuesday action.
The precious metal has been down nine of that past 11 sessions and hasn’t drawn much of a bid in recent weeks on the expectation that the Fed may raise interest rates for the first time since 2006. Interest-bearing assets like Treasurys have diminished the appeal of gold, which doesn’t bear any interest, while anticipation of a near-term rate increase has dulled expectations for gold.

SIGN UP FOR DAILY-FREE FOREX SIGNALS

Thursday 3 September 2015

European stocks reversed earlier losses to close higher Wednesday

     SIGN UP FOR DAILY-FREE FOREX SIGNALS     


European stocks reversed earlier losses to close higher Wednesday, with worries about an economic slowdown in China offset by a strong open on Wall Street. France's CAC 40 was up by 13.76 points to 4,554.92 and Germany's DAX 30 gain 32.48 points to 10,048.05. FTSE 100 also managed to close at 6,083.31 with net gain of 24.77. US stocks ended higher on Wednesday, rebounding from two days of losses. The Dow Jones 30 gain 293.03 points to 16,351.38, while the S&P 500 and the Nasdaq 100 also gain 35.01 and 113.90 points to 1,948.86 and 4265.23 respectively. Asian markets traded on mix today. Japan’s Nikkei 225 which is only index traded on green note and up by 148.23 points to 18,243.63. Other Asian index like Hong Kong’s Hang Seng 50 Index is off today and Australia’s S&P/ASX 200 closed at negative note.

Index
Value
Net Change
Dow30
16,351.38
+293.03
S&P500
1,948.86
+35.01
NASDAQ100
4256.23
+113.9
DAX 30
10,048.05
+32.48
FTSE100
6,083.31
+24.77
CAC 40
4,554.92
+13.76
Nikkei225
18,243.63
+148.23
S&P/ASX200
5,041.50
-59.96
Hang Seng50
20,934.94
0.00

SUMMARY:
Major trend of Dow Jones 30 is bearish on daily charts. It has given upside recovery in last week trading session. It is again showing good recovery from lower level. It is likely to give northward movement in upcoming session as it has give closing below 50 DMA and trading with resistance of 200 DMA on hourly chart. On lower side it has support level of 16100. If it manages to sustain above 50 DMA and gives break out above 200 DMA then it would bring a strong confidence to reach 16700. Currently it is having resistance of 16400.

INDICATOR:-
RSI is about to cross up the 50 mark on hourly chart time frame. On ADX is likely to move up with strong accumulation on chart. ADX trading above 35 mark. If it sustain above the same then index would come in positive territory with positive DI has crossed up negative DI . 


Wednesday 2 September 2015

Daily FX Signals : EURCHF is looking bullish on charts

Daily FX Signals : EURCHF is looking bullish on charts: SUMMARY: The secondary trend of EURCHF is sideways on charts. In its 4 hourly chart, the pair is consolidating with strong positive bi...

EURCHF is looking bullish on charts


SUMMARY:
The secondary trend of EURCHF is sideways on charts. In its 4 hourly chart, the pair is consolidating with strong positive bias and is likely to give break out at upside. Its 30 and 200 DMA are also supporting the upcoming bullish trend in the pair. It is facing an important resistance at the level of 1.0895. If it breaks its resistance level of 1.0900 at upside then we can expect it to show further upside movement.
INDICATORS:-
RSI is sustaining in buying territory supporting the upcoming bullish trend in the pair.
MACD is also sustaining in buying territory indicating the upcoming bullish trend in the pair.

STRATEGY: EURCHF is looking bullish on charts for next few trading session. One can go for buy on dips strategy for this pair for intra day to mid term positions.

S3
S2
S1
PIVOT
R1
R2
R3
EUR/USD
1.1108
1.1156
1.1237
1.1285
1.1366
1.1414
1.1495
GBP/USD
1.5153
1.5225
1.5264
1.5336
1.5375
1.5447
1.5486
USD/JPY
116.64
117.95
118.66
119.97
120.68
121.99
122.70
USD/CHF
0.9431
0.9498
0.9540
0.9607
0.9649
0.9716
0.9758
AUD/USD
0.6819
0.6914
0.6967
0.7062
0.7115
0.7210
0.7263
EUR/GBP
0.7229
0.7264
0.7329
0.7364
0.7429
0.7464
0.7529
USD/CAD
1.3018
1.3067
1.3163
1.3212
1.3308
1.3357
1.3453
NZD/USD
0.6224
0.6269
0.6302
0.6347
0.6380
0.6425
0.6458

Monday 24 August 2015

GBPUSD Is Bullish | Free Forex Signals | Currency Trading


Get daily free forex signals on your mobile, by our research experts, based on fundamental and technical analysis.

Today we are sharing GBPUSD Currency Trading Signals.  

Daily Forex Signals
Daily Forex Signals Free


RECOMMENDATION :  BUY                                                     

TARGET 1.5800

SIGN UP FOR DAILY-FREE FOREX SIGNALS

SUMMARY:

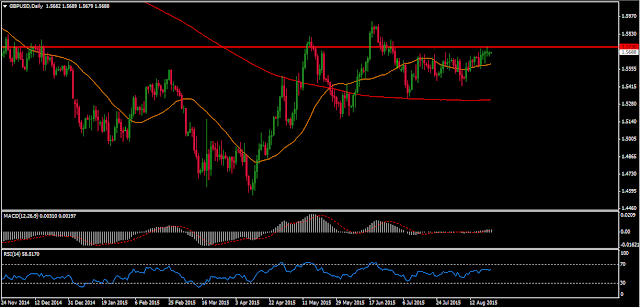
The secondary trend of GBPUSD is sideways on charts. In its daily chart, the pair is consolidating with strong positive bias to give break out at upside. Its 30 and 200 DMA are also supporting the further uptrend in the prices. If it breaks the level of 1.5730 & sustains above it then we can expect it to come up to the levels of 1.5770/1.5800  in next few days.

GBPUSD Chart Today
GBPUSD Chart Today


INDICATORS:-

RSI - Prices are sustaining in buying teritorry, supporting the upside movement in the market.
MACD is also sustaining above the zero line indicating the upside movement in the market.

STRATEGY: 

GBPUSD is looking bullish on charts for next few session. One can go for buy on dips strategy for this pair for intra day to mid term positions.


SIGN UP FOR DAILY-FREE FOREX SIGNALS


Monday 10 August 2015

EUR/GBP Is Bullish For Next Few Sessions | Free Forex Signals | Currency Trading

Get daily free forex signals on your mobile, by our research experts, based on fundamental and technical analysis.

Today we are sharing EUR/GBP Currency Trading Signals.  

DAILY FOREX SIGANALS


RECOMMENDATION : BUY

TARGET : 0.7170

SIGN UP FOR DAILY-FREE FOREX SIGNALS

EURGBP ( 4 HOURLY )


EUR/GBP CHART TODAY
EUR/GBP CHART TODAY


SUMMARY:

The secondary trend of EURGBP is sideways on charts. In its 4 hourly chart, the pair is  sustaining below its falling trend line and consolidating with strong positive  bias to give break out at upside. Its 30 and 200 DMA are also providing support to the upside movement in the prices. If it crosses its resistance level of 0.7100 then we can expect it to come up to the levels of 0.7140/0.7170  in next few days.

INDICATORS:

RSI - Prices are sustaining in buying teritorry, supporting the up side movement in the market.
MACD line is also sustaining above the zero line indicating the upside movement in the market.

STRATEGY: 

EURGBP is looking bullish on charts for next few session. One can go for buy on dips strategy for this pair for intra day to mid term positions.


Wednesday 5 August 2015

USD/JPY Looking Bullish | Free Forex Signals | Currency Trading

Get daily free forex signals on your mobile, by our research experts, based on fundamental and technical analysis.

Today we are sharing USD/JPY Currency Trading Signals. 

Daily Forex Signals
FREE FOREX SIGNALS


SUMMARY:

The primary trend of USDJPY is bullish on charts and from past few trading sessions, the pair is successfully sustaining at higher levels. In its 4 hourly chart, the pair is consolidating with strong positive bias to continue its up rally. Its 30 and 200 DMA are also supporting the upcoming bullish trend in the pair. It is facing an important resistance at the level of 124.62. If it breaks its resistance level at upside then we can expect it to test the level of 125/125.40.

SIGN UP FOR DAILY-FREE FOREX SIGNALS


USDJPY ( 4 HOURLY )


USD/JPY Chart Today
USD/JPY Chart Today


INDICATORS:-

RSI is sustaining in buying territory supporting the upcoming bullish trend in the pair. 
MACD line is sustaining in buying territory supporting the upcoming bullish trend in the pair.

STRATEGY: 

USDJPY is looking bullish on charts for next few trading session. One can go for buy on dips strategy for this pair for intra day to mid term positions.


SIGN UP FOR DAILY-FREE FOREX SIGNALS


Monday 3 August 2015

GBP/USD Is Bullish On Charts | Daily Forex Signals | Weekly Reports

Get daily free forex signals on your mobile, by our research experts, based on fundamental and technical analysis.

Today we are sharing GBP/USD Currency Trading Signals. 

Daily Forex Signals
Daily Forex Signals


SUMMARY:

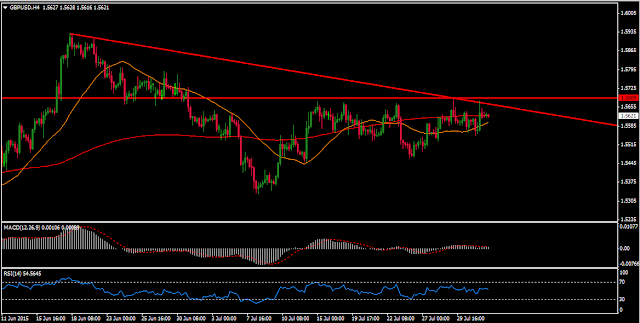
The secondary trend of GBPUSD is sideways on charts. In its 4 hourly chart, the pair is consolidating with strong positive bias to give break out at upside. Its 30 and 200 DMA are also supporting the further uptrend in the prices. If it breaks the level of 1.5690 & sustains above it then we can expect it to come up to the levels of 1.5740/1.5780  in next few days.

SIGN UP FOR DAILY-FREE FOREX SIGNALS


GBPUSD ( 4 HOURLY )

GBPUSD Weekly Chart
GBPUSD Weekly Chart


INDICATORS:-

RSI - Prices are sustaining in buying teritorry, supporting the upside movement in the market.
MACD line is also sustaining above the zero line indicating the upside movement in the market.

STRATEGY:- 

GBPUSD is looking bullish on charts for next few session. One can go for buy on dips strategy for this pair for intra day to mid term positions.


SIGN UP FOR DAILY-FREE FOREX SIGNALS


Monday 27 July 2015

USDCHF Is Buliish On Charts | Free Forex Signals | Currency Tradng

Get daily free forex signals on your mobile, by our research experts, based on fundamental and technical analysis.

Today we are sharing EUR/USD Currency Trading Signals. 

Daily Forex Signals
Daily Forex Signals


SUMMARY:

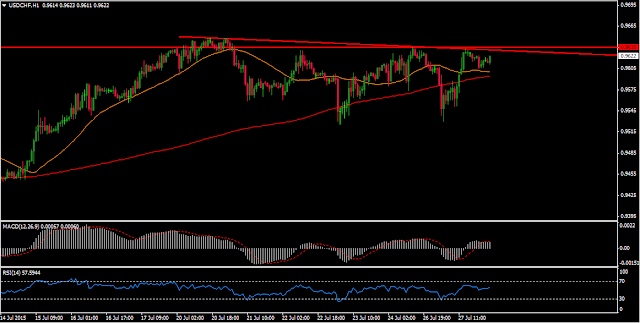
The primary trend of USDCHF is bullish on charts and from past few trading sessions, the pair is successfully sustaining at higher levels. In its hourly chart, the pair is consolidating with strong positive bias to continue its up rally. Its 30 and 200 DMA are also supporting the upcoming bullish trend in the pair. It is facing an important resistance at the level of 0.9635. If it breaks its resistance level at upside then we can expect it to test the level of 0.9680/0.9715.

SIGN UP FOR DAILY-FREE FOREX SIGNALS


USDCHF ( HOURLY ) :


USDCHF Chart Today
USDCHF Chart Today


INDICATORS:-

RSI is sustaining in buying territory supporting the upcoming bullish trend in the pair. 
MACD line is sustaining in buying territory supporting the upcoming bullish trend in the pair.

STRATEGY: 

USDCHF is looking bullish on charts for next few trading session. One can go for buy on dips strategy for this pair for intra day to mid term positions.


SIGN UP FOR DAILY-FREE FOREX SIGNALS


Tuesday 7 July 2015

EURUSD Is Sideways On Charts | Free Forex Signals | Currency Trading

Get daily free forex signals on your mobile, by our research experts, based on fundamental and technical analysis.

Today we are sharing EUR/USD Currency Trading Signals. 


Daily Forex Signals
SUMMARY:

The secondary trend of EURUSD is sideways on charts but from past few trading sessions prices are not sustaining at higher levels. In its 4 hourly chart, prices are consolidating with strong negative bias to give break out at downside. Its 30 and 200 DMA are also providing resistance to the prices & supporting the further downtrend. The pair is taking support at an important level of 1.0965. If it breaks its support level & sustains below it then we can expect it to come down to the levels of 1.0905/1.0870  in next few days.

SIGN UP FOR DAILY-FREE FOREX SIGNALS


EURUSD ( 4 Hourly )

EURUSD Chart Today
EURUSD Chart Today


INDICATORS:

MACD is sustaining in selling territory, supporting the further down side movement in the market.

STRATEGY: 

EURUSD is looking bearish on charts for next few trading session. One can go for sell on higher level strategy for this pair for intra day to mid term positions.

PIVOT POINTS :


S3
S2
S1
PIVOT
R1
R2
R3
EUR/USD
1.0894
1.0944
1.0995
1.1045
1.1096
1.1146
1.1197
GBP/USD
1.5442
1.5486
1.5546
1.5590
1.5650
1.5694
1.5754
USD/JPY
120.66
121.19
121.88
122.41
123.10
123.63
124.32
USD/CHF
0.9323
0.9363
0.9395
0.9435
0.9467
0.9507
0.9539
AUD/USD
0.7364
0.7406
0.7453
0.7495
0.7542
0.7584
0.7631
EUR/GBP
0.7009
0.7039
0.7061
0.7091
0.7113
0.7143
0.7165
USD/CAD
1.2493
1.2528
1.2595
1.2630
1.2697
1.2732
1.2799
NZD/USD
0.6604
0.6635
0.6653
0.6684
0.6702
0.6733
0.6751


SIGN UP FOR DAILY-FREE FOREX SIGNALS